
What is SRTM DEM?
A Digital Elevation Model (DEM) is a generic term for digital topographic and/or bathymetric data, in all its variations. It contains elevation data of the earth surface, either above or below sea level, and includes forest canopies and/or man-made terrain features: artefacts. A special kind of a DEM is one which only provides elevation data of the solid surface of the earth. This bare-earth DEM is called a Digital Terrain Model (DTM).
An international research consortium lead by NASA created the first homogeneous DEM for the planet earth based on data collected in 2000 by the Shuttle Radar Topographic Mission (SRTM). From space shuttle Endeavour a radar instrument sent signals to the ground. It received the reflection twice: on the space ship itself and at the end of a 60m long mast. From these two measurements the elevation of the earth surface could be derived with an horizontal resolution of approximately 30m. In this manner 80% of terrestrial surface of our planet could be covered. The product of that mission has a high value for all earth sciences. With an reduced resolution of 90m all data is provided for free from: https://www2.jpl.nasa.gov/srtm/
Why to process SRTM DEM before using it?
SRTM DEM derived from radar interferometry represent the earth’s surface only in areas with low or sparse vegetation and low building densities. Particularly forest canopies cause problems for terrain analysis. If you are working on a continental scale this is not a problem. For e-SOTER however the plan is to work on much larger scales so the vegetation features represented in SRTM DEM come up. Especially in lowlands the differences in elevation are mainly caused by the change of forest to non forest areas. This can produce misinterpretations. To model the distribution of soil conditions e.g. for farming, hydrological planning or environmental protection purposes a DTM (not a DEM) is needed. For example you can simulate surface runoff to get an idea about the size and shape of watersheds which affects the soil properties inside. If forest canopies remain in the elevation model used for modelling of surface runoff a misled stream network will be derived and forests in lowlands will act as watersheds.
How was SRTM DEM processed?
The objective of SRTM DEM processing is the conversion of a DEM of the vegetation surface into a DEM of the earth’s surface.The presented figures demonstrate the effects of both using unprocessed SRTM DEM and the enhanced SRTM DTM for the modelling in context of e-SOTER. The examples represent a part of the Central European window area of e-SOTER: in particular the upper reaches of the Tisza river as well as parts of the Great Hungarian Plain.
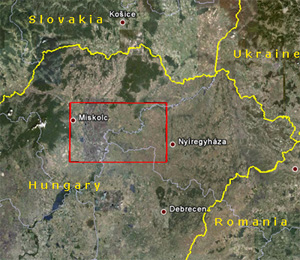
Location of test area
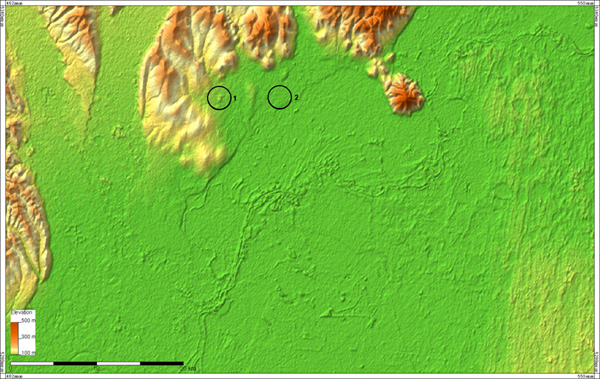
Figure 1. SRTM DEM Original
Figure 1 represents a shaded relief map derived from original SRTM elevation data (DEM). Besides forest canopies DEM produced with radar technology normally contain a typical “noise”. This can be recognized by an edgy appearance of the surface that does not exist in reality.

Figure 2. Processed SRTM DEM
Figure 2 is based on the enhanced SRTM DTM data after the processing procedure. One difference of the result is the “noise” elimination using an advanced filter technique. By using a special algorithm the surface is smoothed but the morphological features of the surface are preserved. However, the main advantage of the processed SRTM DTM is the removal of the features caused by the forest canopy. Therefore, the forest elevation has to be estimated. Calculating the elevation of forest canopies from SRTM DEM without having any information about tree/forest heights certainly is a “mission impossible”. But the estimation of forest elevation - to a certain degree - is possible. For the estimation of forest elevation information about the location (not height) of forest bodies is needed (Figure 3). The estimation of forest elevation is only possible at the forest borders. The flatter the terrain the better is the result of the estimation. The estimated elevation at the forest borders is then interpolated for the complete forest body – sure with inaccuracy within the centre of large forest bodies. At last the estimated values of the forest elevation are subtracted from original SRTM elevation and so the misguiding shapes caused by vegetation are removed from the data.
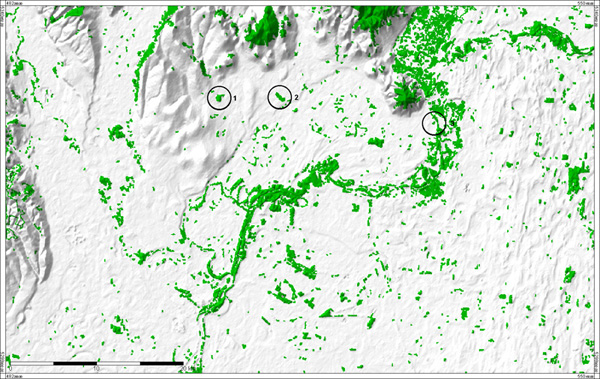
Figure 3. Forest Map
The information of the distribution of forest bodies is provided by the FMAP2000, a product of the Joint Research Centre (JRC) of the European Commission. The properties of that digital data make it very applicable for the usage in e-SOTER SRTM processing. The developed algorithms make use of the information in the following way: only for forest bodies provided by FMAP2000 the forest elevation is estimated. All areas outside stay untouched. However, one difficulty remains: not all forest bodies result in heightening the elevation of the DEM. Circle 1 shows a forest body which results in heightening, circle 2 shows a forest body without heightening the SRTM surface. This can be observed by comparing both circles (1 and 2) in Figures 1 and 2. This means that the information of FMAP2000 about the location of forest bodies could not be equated as the location of vegetation features in SRTM DEM. The clue is the combination: to search and find the “jump” in the elevation values only where forest bodies are located.
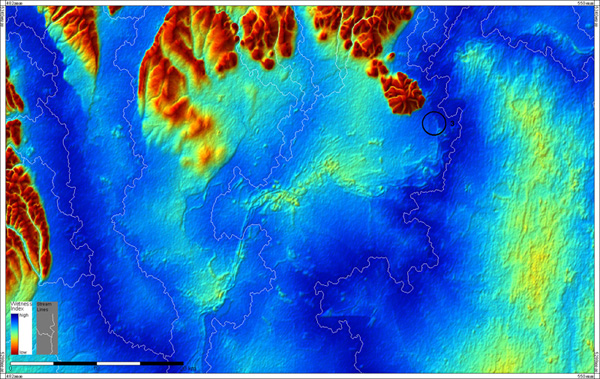
Figure 4. Potential Soil Wetness and Stream Lines – derived form SRTM DEM Original (fig. 1)
Figures 4 and 5 show the terrain parameter ‘potential soil wetness index’ derived from the DEM/DTM. This is a useful parameter for questions that deal with distribution of water on and close below the surface. Although this parameter is theoretical it provides important information (it does not claim that certain areas are in reality ‘wet’ or ‘dry’, but it gives hints about the relative distribution). Sites with a potential better water supply can be delineated from others that have potential dryer conditions.Also stream lines derived from DEM/DTM are presented in this figure. They show the course of theoretical linear water runoff on the DEM/DTM surface. These lines should meet the natural water streams like rivers but in fact they do not. This is because the modelled surface isn’t the real earth’s surface. Minor deviations are unavoidable but should not go beyond the scope.The two described data bases, the DEM and the DTM, result in enormous different derivations in case of stream lines and wetness index. In the case of stream lines “dams” (in fact forest canopies in the DEM) block the runoff of the lines (see e.g. circle 3 in comparison with Figure 5), resulting in redirection of the complete stream network in the Great Hungarian Plane. The forest canopies act as drainage divides. The Forest bodies also cause low values of wetness index in Tisza valley where high values are to be expected (see centre of Figure 4). Both derivations in Figure 4 show unacceptable results.
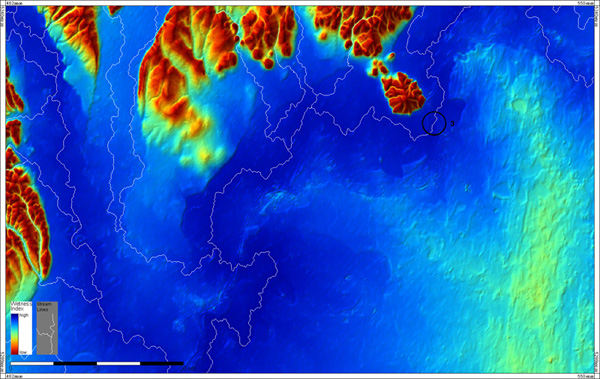
Figure 5. Potential Soil Wetness and Stream Lines – derived form SRTM DEM processed (Figure 2)
Much more plausible are the results when the processed SRTM DTM is used. The low values of wetness index caused by forest bodies (centre of Figure 4) mostly turned into high values in the Tisza valley. Only a few redirections occur for some stream lines. Plausible results of terrain analysis in earth sciences are now available and the designation of homogeneous e-SOTER landform units is improved.